Improving the write-what-where HEVD PoC (x86, Win7)

Introduction
This one is about another HEVD exercise (look here to see the my previous HEVD post); the arbitrary write (https://github.com/hacksysteam/HackSysExtremeVulnerableDriver/blob/master/Driver/HEVD/Windows/ArbitraryWrite.c). The main reason I decided to write up my experience with it is the fact that it instantly occurred to me that the official exploitation process, used both in the original PoC as well as described here, leaves the kernel in an unstable state with high probability of crash anytime after the exploit is run. So, this post is more about the exploitation technique, the problem it creates and the solution it asks for, rather than the vulnerability itself. It also occurred to me that doing HEVD exercises fully (like understanding exactly what and how) is quite helpful in improving the general understanding of how the operating system works.
When it comes to stuff like setting up the environment, please refer to my earlier HEVD post. Now let's get started.
The vulnerability
This one is a vanilla write-what-where case - code running in kernel mode performs a write operation of an arbitrary (user-controlled) value into an arbitrary (user-controlled) address. In case of a x86 system (we keep using these for such basic exercises as they are easier while debugger output with 32-bit addresses is more readable), it usually boils down to being able to write an arbitrary 32-bit value into an arbitrary 32-bit address. However, it is also usually possible to trigger the vulnerability more than once (which we will do in this case, by the way, just to fix the state of the kernel after privilege escalation), so virtually we control data blocks of any size, not just four bytes.
First of all, we have the input structure definition at https://github.com/hacksysteam/HackSysExtremeVulnerableDriver/blob/master/Exploit/ArbitraryOverwrite.h - it's as simple as it could be, just two pointers:
Then, we have the TriggerArbitraryWrite function in https://github.com/hacksysteam/HackSysExtremeVulnerableDriver/blob/master/Driver/HEVD/Windows/ArbitraryWrite.c (screenshot below). First, we have a call to ProbeForRead on the input pointer, to make sure that the structure itself is located in user space (both ProbeForRead and ProbeForWrite methods throw an access violation exception if the address provided turns out to belong to the kernel space address range). Then, What and Where values held by the structure (note that these are both pointers and there are no additional checks here whether the addresses those pointers contain belong to kernel or user space!) are copied into the local kernel mode function variables:
Then, we have the vulnerable write-what-where:
Now, let's see how this C code actually looks like after it's compiled (disassembly view in windbg):
Exploitation
So, as always, we just want to run our shellcode in kernel mode, whereas the only thing our shellcode does is overwriting the security token of our exploit process with the one of the SYSTEM process (token-stealing shellcode). Again, refer to the previous blog post https://hackingiscool.pl/hevd-stackgs-x86-win7/ to get more details on the shellcode used.
To exploit the arbitrary write-what-where to get our shellcode executed by the kernel, we want to overwrite some pointer, some address residing in the kernel space, that either gets called frequently by other processes (and this is what causes trouble post exploitation if we don't fix it!) or is called by a kernel-mode function that we can call from our exploit process (this is what we will do to get our shellcode executed). In this case we will stick to the HalDispatchTable method - or to be more precise, HalDispatchTable+0x4. The method is already described here https://poppopret.blogspot.com/2011/07/windows-kernel-exploitation-basics-part.html (again, I recommend this read), but let's paraphrase it.
First, we use our write-what-where driver vulnerability to overwrite 4 bytes of the the nt!HalDispatchTable structure (nt!HalDispatchTable at offset 0x4, to be exact). This is because the NtQueryIntervalProfile function - a function that we can call from user mode - results in calling nt!KeQueryIntervalProfile (which already happens after switching into kernel mode), and that function calls whatever is stored at nt!HalDispatchTable+0x4:
So, the idea is to first exploit the arbitrary write to overwrite whatever is stored at nt!HalDispatchTable+0x4 with the user-mode address of our shellcode, then call the NtQueryIntervalProfile only to trick the kernel into executing it via calling HalDisaptchTable+0x4 - and it works like a charm on Windows 7 (kernel mode execution of code located in user mode buffer, as no SMEP in place).
The problem
The problem is that nt!HalDispatchTable is a global kernel structure, which means that once we tamper it, it will still be there if any other program refers to it (e.g. calls NtQueryIntervalProfile). And it WILL affect whatever we will be doing enjoying our SYSTEM privileges, because it WILL crash the entire system.
Let's say that the buffer holding our shellcode in our user mode exploit is at 00403040. If we overwrite the original value of nt!HalDispatchTable+0x4 with it, that shellcode will only be reachable and thus callable if the current process being executed is our exploit. Once the scheduler interrupt switches the current CPU core to another process, in the context of that process the user mode virtual address of 00403040 will either be invalid (won't even fall into any committed/reserved virtual address range within the virtual address space used by that process) or it will be valid as an address, but in reality it will be mapped to a different physical address, which means it will hold something completely different than our shellcode. Remember, each process has its own address space, separate from all other processes, whereas the address space of the kernel is global for the entire system. Therefore every kernel space address makes sense to the entire system (kernel and all processes), whereas our shellcode at 00403040 is only accessible to our exploit process AND the kernel - but only when the process currently being executed is our exploit. The same address referred to from a different process context will be invalid/point at something completely different.
So, after we tamper HalDispatchTable+0x4 by overwriting it with the address of the shellcode residing in the memory of the current process (our exploit) and call NtQueryIntervalProfile to get the shellcode executed, our process should now have SYSTEM privileges (and so will any child processes it spawns, e.g. a cmd.exe shell).
Therefore, if any other process in the system, after we are done with privilege escalation, calls NtQueryIntervalProfile, it will as well trick the kernel into trying to execute whatever is located under the 00403040 address. But since the calling process won't have this address in its working set or will have something completely different mapped under it, it will lead to a system crash. Of course this could be tolerated if we performed some sort of persistence immediately upon the elevation of privileges, but either way as attackers we don't want disruptions that would hurt our customer or potentially tip the defenders off. We don't want system crashes.
This is not an imaginary problem. Right after running the initial version of the PoC (which I put together based on the official HEVD PoC), all of the sudden I saw this in windbg:
Obviously whatever was located at 0040305b at the time ( 000a - add byte ptr [edx],cl), was no part of my shellcode. So I did a quick check to see what was the process causing this - by issuing the !vad command to display the current process VADs (Virtual Address Descriptors), basically the memory map of the current process, including names of the files mapped into the address space as mapped sections - which includes the path to the original EXE file:
One more interesting thing is that - if we look at the stack trace (two screenshots above) - the call of HalDispatchTable+0x4 did not originate from KeQueryIntervalProfile function, but from nt!EtwAddLogHeader+0x4b. Which suggests that HalDispatchTable+0x4 is called from more places than just NtQueryIntervalProfile, adding up to the probability of such a post-exploitation crash being very real.
The solution
So, the obvious solution that comes to mind is restoring the original HalDispatchTable+0x4 value after exploitation. The easiest approach is to simply trigger the vulnerability again, with the same "where" argument ( HalDispatchTable+0x4) and a different "what" argument (the original value as opposed to the address of our user mode shellcode).
Now, to be able to do this, first we have to know what that original value of nt!HalDispatchTable+0x4 is. We can't try to read it in kernel mode from our shellcode, since we need to overwrite it first in order to get the shellcode execute in the first place. Luckily, I figured out it can be calculated based on information attainable from regular user mode execution (again, keep in mind this is only directly relevant to the old Windows 7 x86 I keep practicing on, I haven't tried this on modern Windows yet, I know that SMEP and probably CFG would be our main challenges here).
First of all, let's see what that original value is before we attempt any overwrite. So, let's view nt!HalDispatchTable:
The second DWORD in the memory block under nt!HalDispatchTable contains 82837940. Which definitely looks like an address in kernel mode. It has to be - after all, it is routinely called from other kernel-mode functions, as code, so it must point at kernel mode code. Once I called it up with dt command, windbg resolved it to HaliQuerySystemInformation. Running disassembly view command uu on it, revealed the full symbol name (hal!HaliQuerySystemInformation) and showed that in fact there is a function there (just based on the first few assembly lines we can see it is a normal function prologue).
OK, great, so we know that nt!HalDispatchTable+0x4, the pointer we abuse to turn arbitrary write into a privilege escalation, originally points to a kernel-mode function named hal!HaliQuerySystemInformation (which means the function is a part of the hal module).
Let's see more about it:
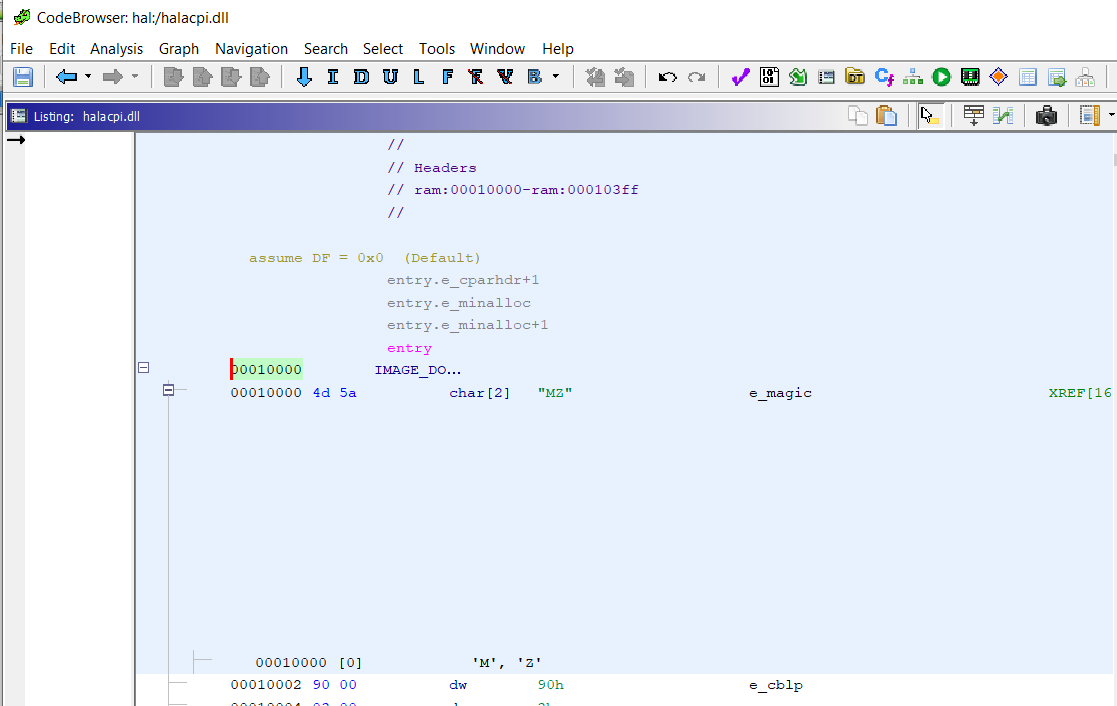
Oh, so the module name behind this is halacpi.dll. Now we both have the function name and the module name. Based solely on this information, we can attempt to calculate the current address of hal!HaliQuerySystemInformation dynamically. To do this, we will require the following two values:
- The current base address the halacpi.dll module has been loaded (we will get it dynamically by calling
NtQuerySystemInformationfrom our exploit). - The offset of the
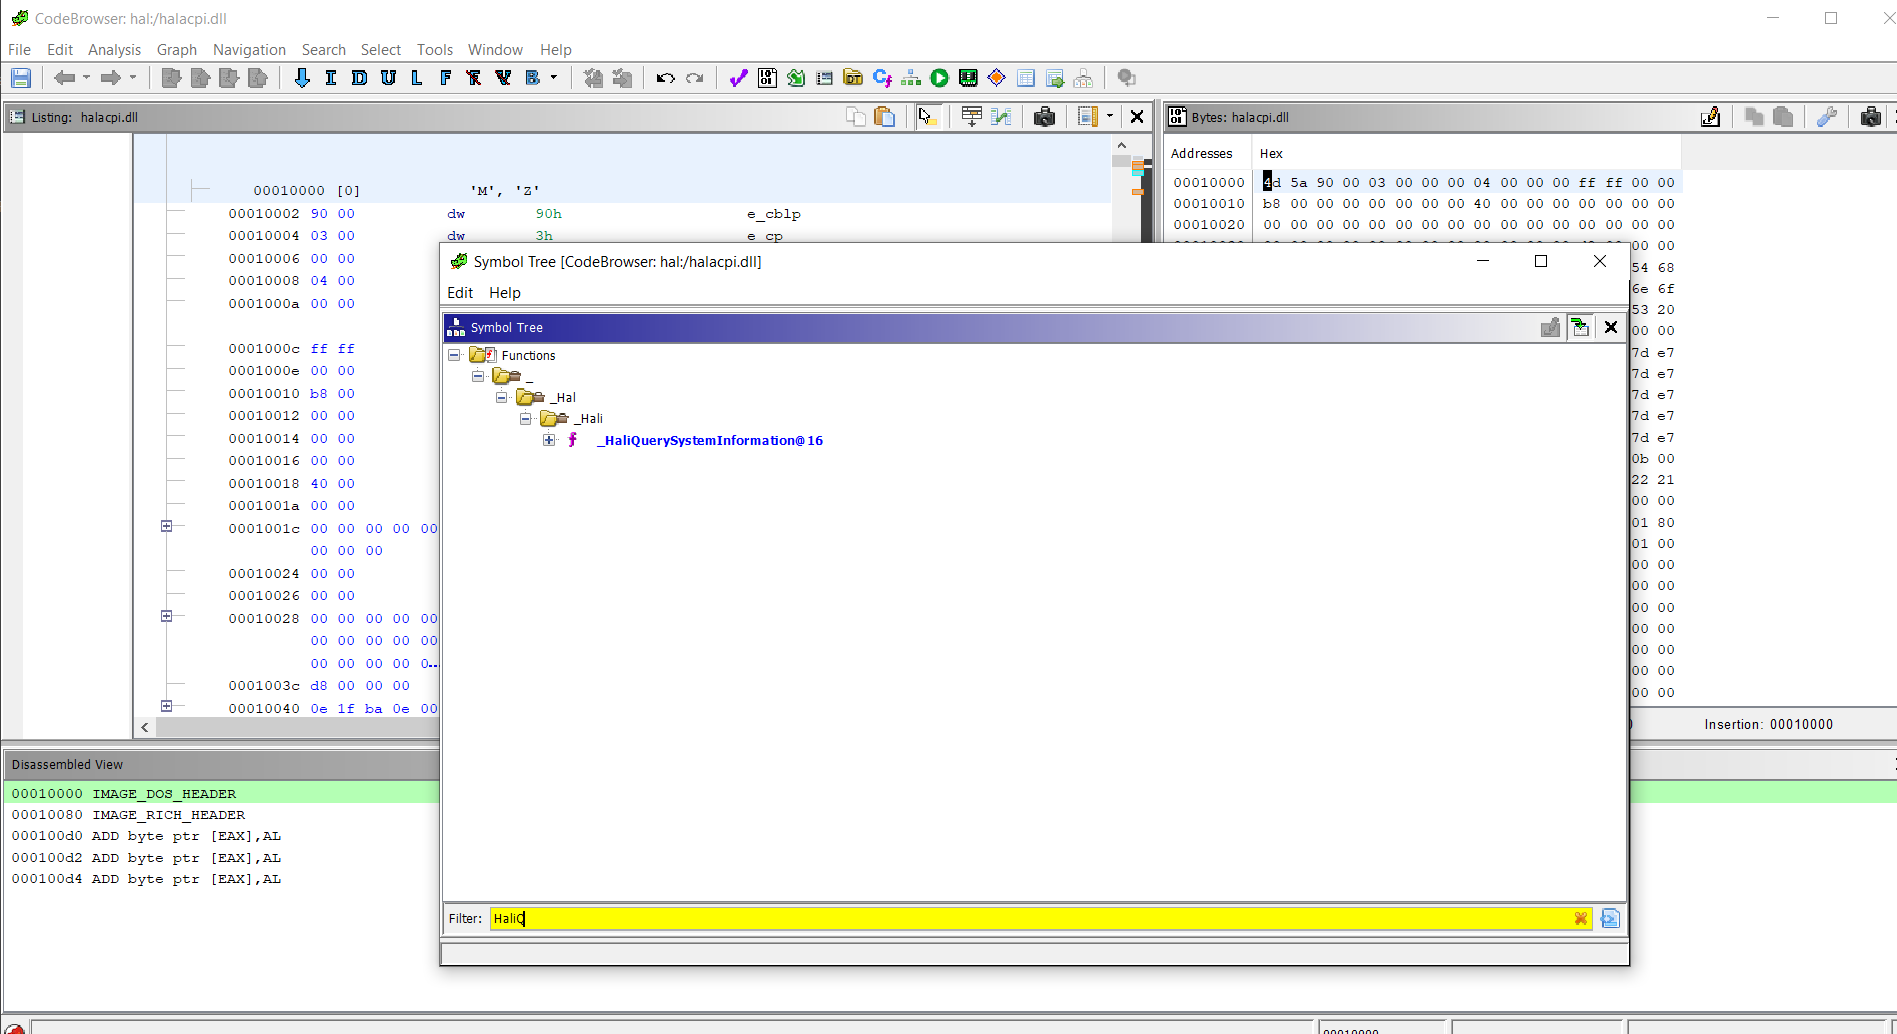
HaliQuerySystemInformationfunction within the halacpi.dll module itself (we will pre-calculate the offset value and hardcode it into the exploit code - so it will be version-specific). We can calculate this offset in windbg by subtracting the current base address of the halacpi.dll kernel-mode module (e.g. taken from thelmDvmhalcommand output) from the absolute address of thehal!HaliQuerySystemInformationfunction as resolved by windbg. We can also calculate (confirm) the same offset with static analysis - just load that version of halacpi.dll into Ghidra, download the symbols file, load the symbols file, then find the static address of the function with its address within the binary and subtract the preferred module base address from that address.
Below screenshot shows the calculation done in windbg:
Below screenshots show the same process with Ghidra:
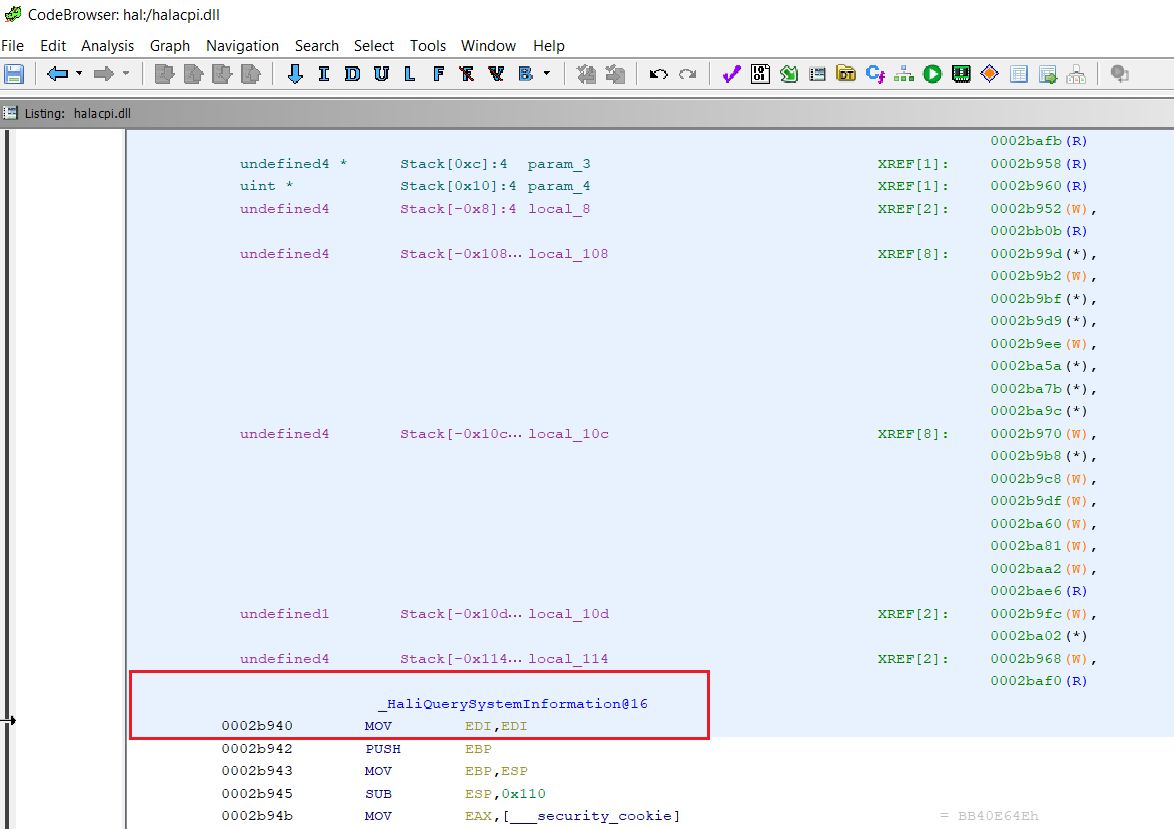
Offset calculation based on information from Ghidra: 0x2b940 - 0x10000 = 0x1b940.
So, during runtime, we need to add 0x1b940 (for this particular version of halacpi.dll - remember, other versions will most likely have different offsets) to the dynamically retrieved load base address of halacpi.dll, which we retrieve by calling NtQuerySystemInformation and iterating over the buffer it returns (see the PoC code for details). The same function, NtQuerySystemInformation, is used to calculate the runtime address of the HalDispatchTable - the "what" in our exploit (as well as the original HEVD PoC code and many other exploits of this sort). In all cases NtQuerySystemInformation is called to get the current base address of the ntoskrnl.exe module (the Windows kernel). Then, instead of using a hardcoded (fixed) offset to get HalDispatchTable, a neat trick with LoadLibraryA and GetProcAddress is used to calculate it dynamically during runtime (see the full code for details).
The reason I could not reproduce this fully dynamic approach of calculating the offset from the base (calling LoadLibrary(halacpi.dll) and then GetProcAddress(HaliQuerySystemInformation)) to calculate hal!HaliQuerySystemInformation and used a hardcoded, fixed, manually precalculated 0x1b940 offset instead, is because the HaliQuerySystemInformation function is not exported by halacpi.dll - whereas GetProcAddress only works for functions that have their corresponding entries present in the DLL Export Table.
Full PoC
The full PoC I put together can be found here: https://gist.github.com/ewilded/4b9257b552c6c1e2a3af32879f623803.